Paste a Few Files Into One and Plot ... Take 2
I was trying to work on this new requirement based on my previous work, but I was not getting anywhere and the code started to become 'spaghetti'. My new approach will be to work with epoch time as integer instead of YYYYmmddHHMMSs time format as string. Hey, this is another chance for me to brush up my Python skill. In this exercise, I tried to tap onto the wealth of Python modules (eg. sets, datetime, time) and they proved to be very handy.
Below is my data set and I am trying to put them side by side for easy comparison. As you can see they are all having different samping time, start time, end time. My python program not only will merge the 3 files together, it also round-off the timestamp based on the defined resolution. Average value will be calculated if more than one sampling data within the sampling time resolution (see last 2 lines in t1.txt).
$paste t1.txt t2.txt t3.txt 20080725101223:14 20080725083225:23 20080725083225:32 20080725102225:15 20080725084230:21 20080725084230:32 20080725103227:15 20080725085228:29 20080725085228:34 20080725104233:19 20080725090235:29 20080725090235:36 20080725105235:18 20080725091233:28 20080725091233:37 20080725110236:11 20080725092232:27 20080725092232:37 20080725111237:12 20080725093225:27 20080725093225:37 20080725112231:12 20080725094229:28 20080725094229:33 20080725113241:13 20080725095225:26 20080725095225:32 20080725114236:14 20080725100221:21 20080725100221:34 20080725115241:14 20080725115241:21 20080725101223:33 20080725120235:17 20080725120235:21 20080725102225:33 20080725121231:19 20080725121231:22 20080725103227:33 20080725122232:12 20080725122232:23 20080725104233:37 20080725123238:13 20080725123238:23 20080725105235:37 20080725124237:14 20080725124237:23 20080725110236:37 20080725125237:15 20080725125237:22 20080725111237:39 20080725130239:16 20080725130239:22 20080725112231:34 20080725131233:16 20080725131233:22 20080725132226:14 20080725132226:22 20080725132236:99 $./merge2.py t1.txt t2.txt t3.txt 20080725T083200:0:23:32 20080725T084200:0:21:32 20080725T085200:0:29:34 20080725T090200:0:29:36 20080725T091200:0:28:37 20080725T092200:0:27:37 20080725T093200:0:27:37 20080725T094200:0:28:33 20080725T095200:0:26:32 20080725T100200:0:21:34 20080725T101200:14:0:33 20080725T102200:15:0:33 20080725T103200:15:0:33 20080725T104200:19:0:37 20080725T105200:18:0:37 20080725T110200:11:0:37 20080725T111200:12:0:39 20080725T112200:12:0:34 20080725T113200:13:0:0 20080725T114200:14:0:0 20080725T115200:14:21:0 20080725T120200:17:21:0 20080725T121200:19:22:0 20080725T122200:12:23:0 20080725T123200:13:23:0 20080725T124200:14:23:0 20080725T125200:15:22:0 20080725T130200:16:22:0 20080725T131200:16:22:0 20080725T132200:56.5:22:0
Here is my merge2.py code:
#! /usr/bin/python
#
# merge files together based on round-off timestamp
# no assumption taken regarding having same timestamp for each corresponding row
# data file format: yyyymmddHHMMSS:value
#


import sys, os
import datetime, time
import sets


if len(sys.argv) < 2:
    sys.stderr.write("Usage: %s file1 file2 [file ...]" % (sys.argv[0]))
    sys.exit(1)


def avg(n):
    if len(n)==0:
        return 0
    else:
        return float(sum(n,0.0))/len(n)


resolution = 60


#
# tset - stores the time (round off based on resolution) in epoch
# data - dict with key=[filename,epoch], value=list of values
#
tset = sets.Set()
data = {}
outfmt = '%s'
for f in sys.argv[1:]:
    outfmt = '%s:%s' % (outfmt, '%g')
    for line in open(f):
        ts,value = line.strip().split(':')

        yr  = int(ts[0:4])
        mth = int(ts[4:6])
        day = int(ts[6:8])
        hr  = int(ts[8:10])
        min = int(ts[10:12])
        sec = int(ts[12:14])

        t = datetime.datetime(yr, mth, day, hr, min, sec)
        epoch = int(time.mktime(t.timetuple()))
        epoch = epoch/resolution*resolution
        tset.add(epoch)
        if (f,epoch) not in data:
            data[f,epoch]=[]
        data[f,epoch].append(int(value))


for t in sorted(tset):
    tt = time.localtime(t)
    ts = "%04d%02d%02dT%02d%02d%02d" % (tt[0:6])
    lvalue = [ts]

    for f in sys.argv[1:]:
        if (f,t) in data:
            lvalue.append( avg(data[f,t]) )
        else:
            lvalue.append(0)
    print outfmt % tuple(lvalue)
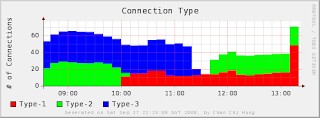
Below plot is created based on my
generic plotting tool. BTW, if you do not need the merged output as text, you can simply populate the data into the
RRDtool.
IBM developerWorks has a very nice article on RRDtool -
Expose Web performance problems with the RRDtool


0 Comments:
Post a Comment
<< Home